Relative Strength Index
It is used to identify potential reversal points or correction, as well as evaluation of «confidence» of the market dynamics.
What is Relative Strength Index?
-
First we determine the type of price change: positive − current (today) closing price, higher than n periods ago (yesterday): U = Close(today) – Closе(yesterday), D = 0 negative − current (today) closing prices, higher than n periods ago (yesterday) D = Close(yesterday) – Close (today), U = 0 If the prices U and D are not equal to zero, then the values of U and D are smoothed using EMA, as a result, «relative strength» (RS) is defined: RS = (EMA[N]of N)/(EMA[N]of D)
-
Second stage: calculate final value of RSI: RSI = 100 – (100/(1+RS))
In some sources, a simple moving average (SMA) is recommended for calculation, but do not forget that initially the indicator was developed for stock market (less volatile), and for Forex, exponential smoothing is considered optimal.
Forex Relative Strength Index is located in a separate window below price chart and represents a curve with a range of values (0-100). In addition to color scheme, main parameter is number of bars to calculate (author recommended value of period 14) and type of price (usually Close).
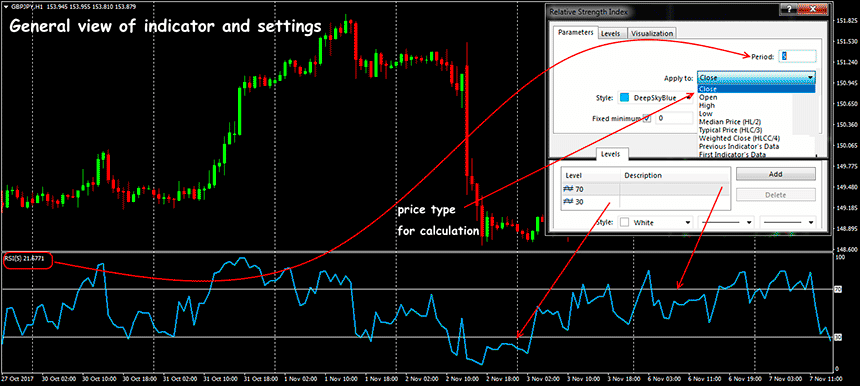
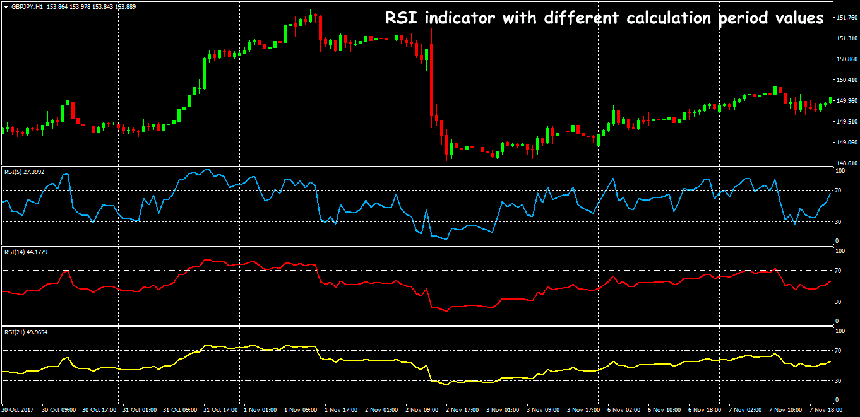
Of the many options, most common are 9-and 25-period RSIs. The shorter RSI calculation period, the more sensitive indicator to current price changes. The smaller timeframe, the longer calculation period, for example, RSI (9) or RSI (14) is recommended for daily chart, for H1 − RSI (5) or RSI (7).
In the indicator window horizontal levels are additionally used: balance − 50 and overbought/oversold − 70/30 or 80/20 (very rarely − 60/40).
You can use the 5% rule: determine (visually) level so that RSI remains behind it for 5% of total trading time for a fairly long period. For example, if you want to analyze use of RSI signals on timeframe D1, then you need to evaluate data for 3 months.
Relative Strength Index trading
It is always necessary to remember what is relative strength index (RSI) − it is a typical oscillator, therefore its signals in critical areas are considered optimal: above level 70 (80) − overbought zone, below 30 (20) − oversold zone. Some analysts advise taking into account levels 30 and 70 only in flat, and 20 and 80 − on a confident trend.
-
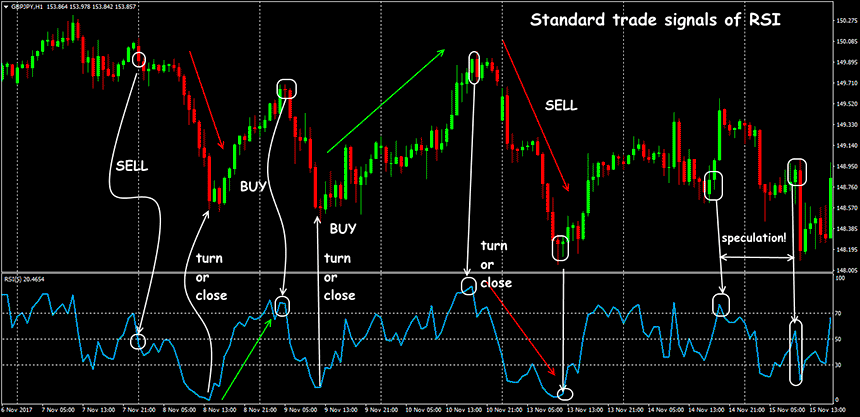
Determine the state of overbought/oversold. We open a deal for sale when the indicator’s graph leaves overbought area (above level 70), from oversold area (below 30) − to buy. You can also use other values of levels depending on current trend: 80/40 with a strong trend and 60/20 for a quieter market. Signal for closing a position is a turn from the opposite critical zone: for example, when the RSI overbought zone is reached, close positions to buy or move StopLoss level closer.
-
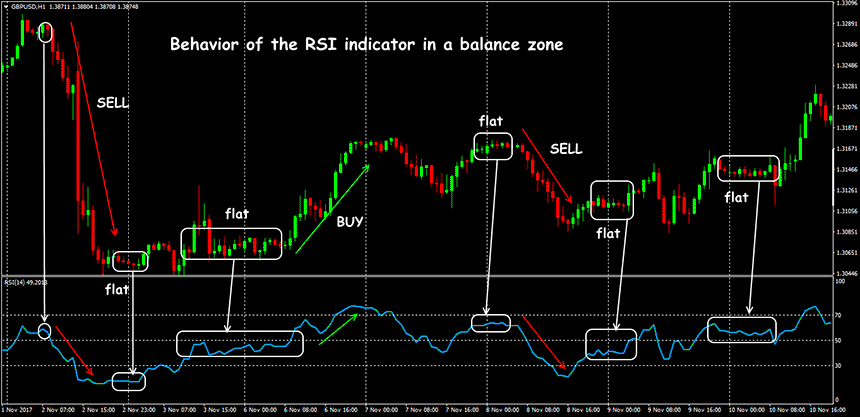
Breakdown of line of balance (level 50). Breakdown from below up – the transaction on purchase, from top to down − for sale. Works only at trend sites, during the flat periods the bulk of signals will be false. On strong trends price is often consolidated at this level. If you look for confirmation of a bull trend, then RSI has to move higher than 50. If you assume that the market will fall – be convinced that RSI is lower than 50.
-
Divergence. Such situations meet rather seldom, but are considered as the strongest signals of a turn. However, if range between maxima and minima of divergence on graphics of RSI is less than 7 or more 50 periods, it isn’t recommended to open transactions.
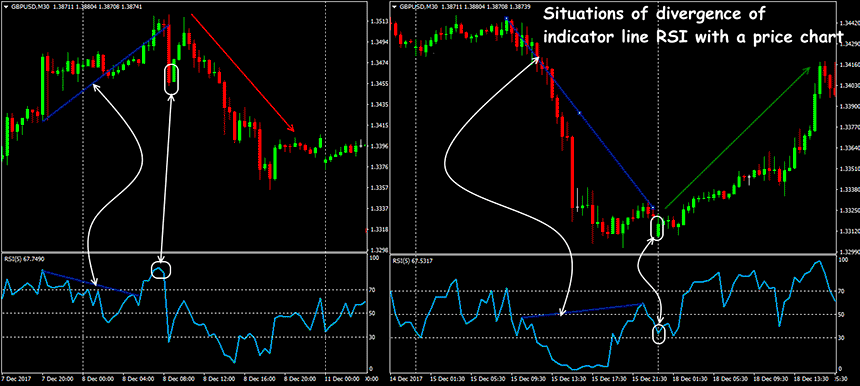
We remind: excess by the indicator of levels 30 and 70 doesn’t say that it is necessary to open the transaction immediately. The market can be in a critical zone long enough, and RSI warns about change of a trend, but doesn’t report when it occurs.
Strategy with use of the indicator
Most often, the Relative Strength Index Forex is used for a scalping during the periods of rather wide flat not to miss the beginning of the strong movement and at the same time to earn on small transactions.
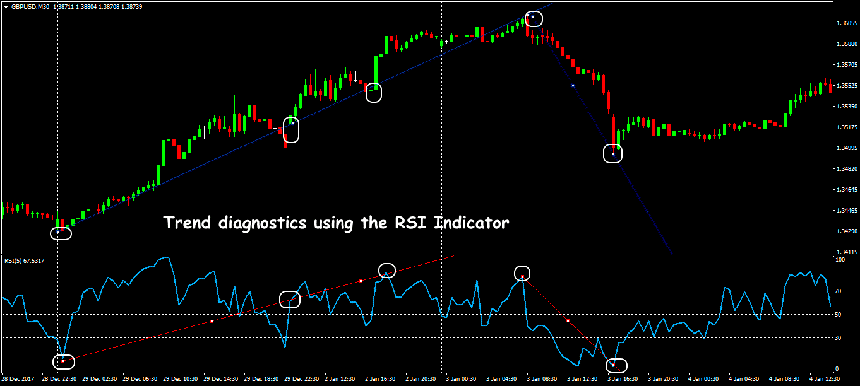
The classical graphic analysis quite well works at the line of Relative-Strength-Index, for example, test of trend lines – the oscillator will warn you about possible breakdown for 3-5 bars prior to this event.
Except levels and trend lines, on graphics of RSI graphic models of the technical analysis, such as «Head Shoulders», «Triangles», «Top/bottom», «Flags» and other also often analyze. Relative Strength Index (RSI) often shows even those classical patterns which on the price schedule are visually not visible.
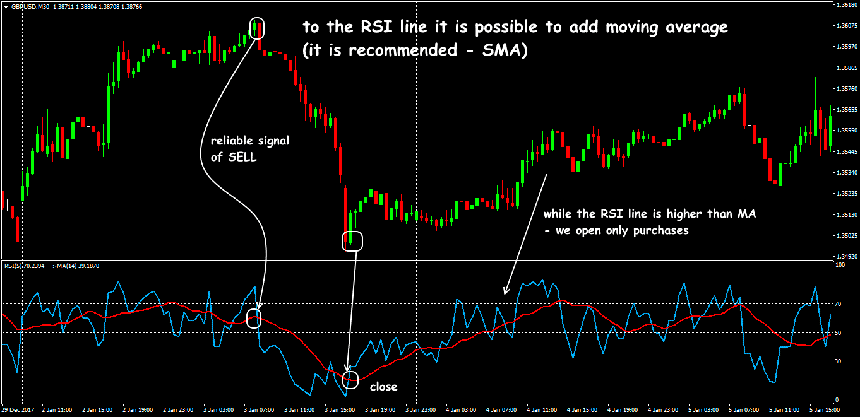
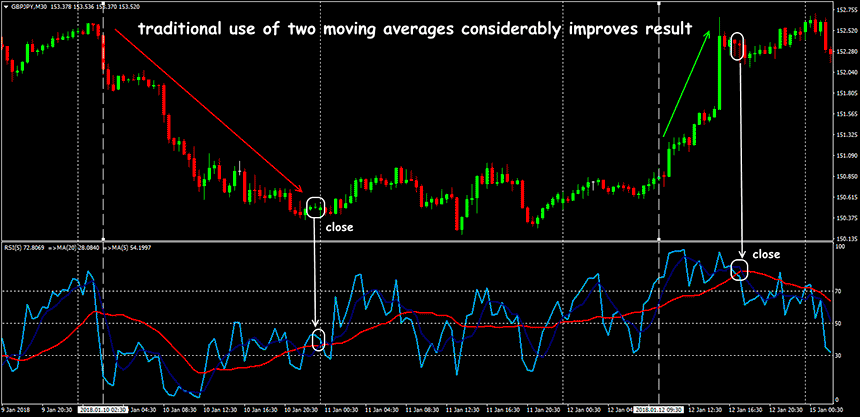
Most of traders uses Relative Strength Index indicator only in a traditional manner, but simple addition of moving average to the line of indicator improves effect of smoothing and does signals on an entrance by more reliable. Besides, the moving average can act as resistance level for the indicator.
Several practical notes
During the unstable market trust to RSI signals considerably decreases. RSI (Relative Strength Index) is the effective filter of current state of the market and perfectly works as the basic oscillator in complex trade strategy.
We remind: RSI is also inherent traditional delay and its signals it is necessary to confirm, for example, with signals of RSI of the senior period or trend tools, such as moving averages.


