Hull Moving Average
Most of us in this or that look is used in the trade by moving averages. But the main problem of all indicators constructed on mathematics of averages - delay. Australian Alan Hull − an analyst, hereditary trader and author of popular books − improved the calculation mechanism and almost completely removed this shortcoming. We suggest improving your trading strategy with Hull Moving Average indicator.
Mathematics and parameters We will remind: since any moving average is calculated on the basis of prices received over the past period of time, it will always lag behind the current price activity.
The basic calculation for the HMA indicator points is similar to the standard Moving Average. An additional quadratic averaging of the values ensures harmonious smoothing of HMA: the value of the “period” parameter participates in the calculation of the Hull moving average, and the value of the square root of the actual data for the current period is used.
Hull applied the method of weight coefficients to price calculations, where in the series from 0 to 9 the element 9 was given the greatest value. Calculation formula of Hull Moving Average in general:

In the author’s opinion, this additional correction reduces the impact of random price shots and HMA indicator curve appears smoother. If to assume that the current market price “is equal” to weight coefficient 9, then received compensation seems exaggerated. However author considers such “supercorrection” very convenient for decrease in influence of casual price throws. Visually HMA line is significantly ahead of real average price.
Indicator Hull Moving Averages is installed in usual way and contains a set of parameters that is traditional for the moving average: price type, period and method of calculating the average, number of bars for price shift relative to the current one. Optimal parameters and colors are shown in the diagram below.
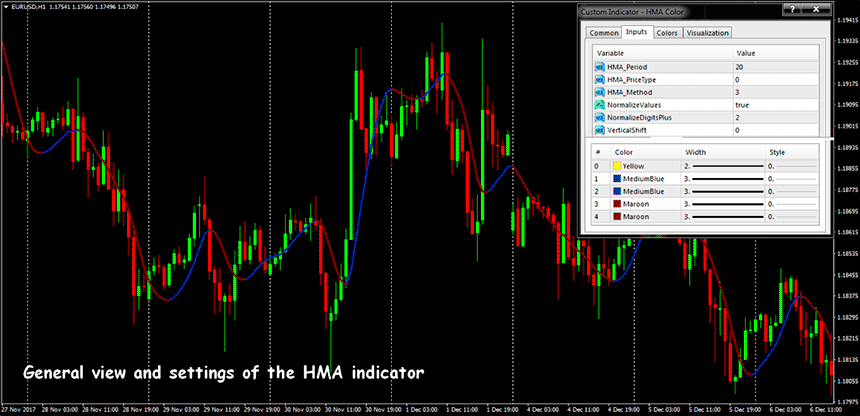
There are several modifications of indicator, but it is usually recommended to use indicator HMA Arrow:
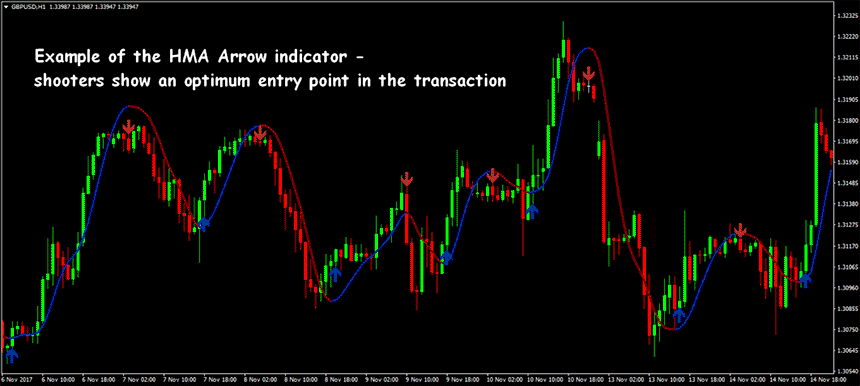
Trade indicator signals
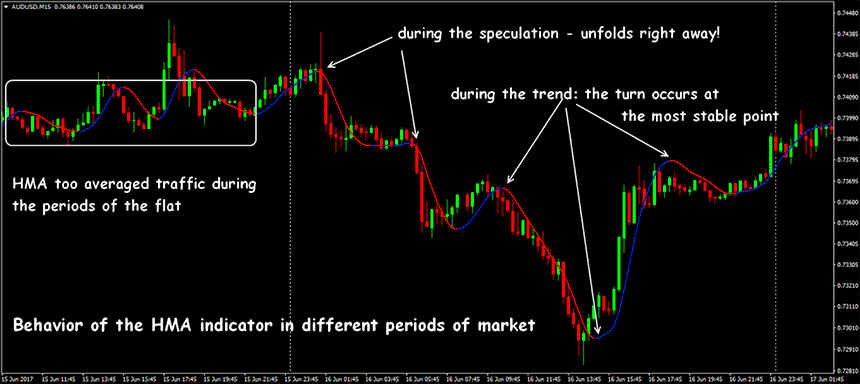
HMA indicator line operates as a normal average - the color, direction and angle of inclination are estimated. Indicator signal is a color change: if the price increases, line is painted in blue (or green) color, if the price moves down − color changes to red. A recommendation (but not a signal!) for buying is situation where price crosses line from bottom up, for sale - if price breaks line from top down.
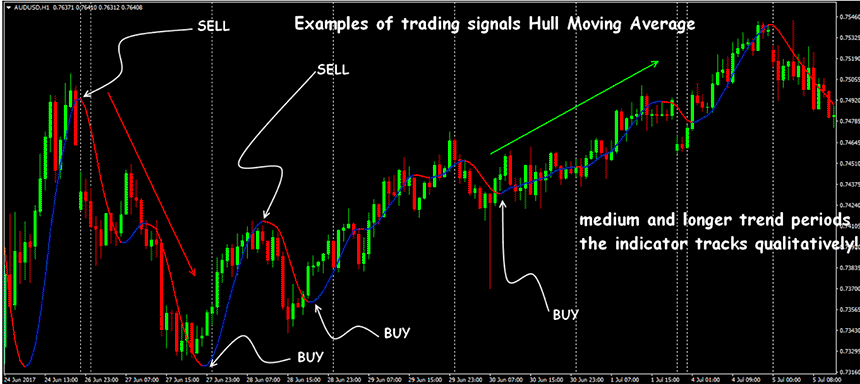
Color can change already at the current bar, so it’s not so much line’s color that should be reacted, but rather its position relative to the current price. Price below the indicator line confirms the downward trend of market, the higher price means that market is growing. Hull moving average is usually ahead of the usual average value and with high accuracy helps to predict a trend reversal for the 2-3 bar. The diagram below shows moving averages HMA and SMA with the same periods − turn signals on HMA line appear much earlier.
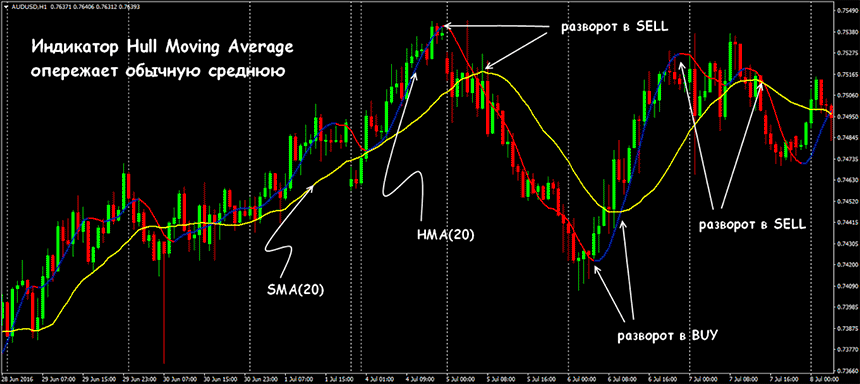
Hull moving average indicator works fine in small and medium periods, the most stable results are obtained for periods of more than 20. For medium-term trading and risk reduction it is recommended to increase period and shift (HMA_period − 55; HMA_shift − 5), then trend change points will appear much less often.
Strategy with use of the indicator
To effectively use HMA indicator as the main trend tool, it must be combined with oscillators (Stochastic, RSI, ADX), or, for example, with popular MACD. And it is necessary − in such systems for all indicators of adjustment of the possible shift of prices should be agreed.
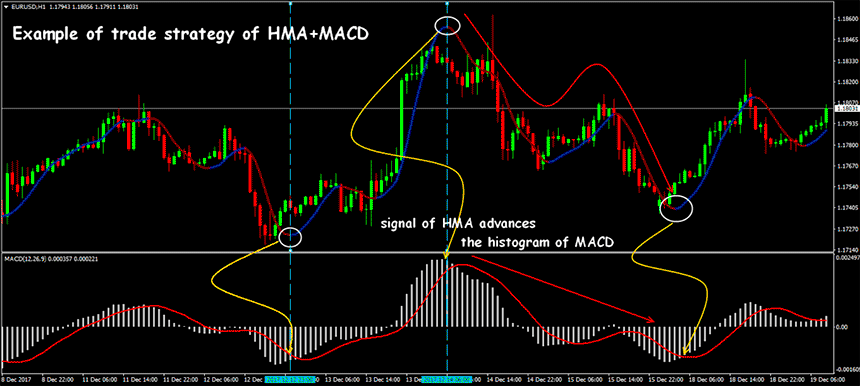
Hull moving average indicator well monitors general trend and is most effective as the turn filter, therefore his signals on closing of a position much more precisely, than his advancing − signals on an entrance. The line of Hull can’t be treated as classical moving average at all, other logic is necessary here. For example, crossing of HMA line with other averages can’t be used as a trade signal.
Several practical notes
A serious drawback of Hull moving average is the fact that as an average moving indicator is not quite consistent with reality. Its value of the average price turns out to be seriously overestimated, and therefore for small periods it is simply dangerous to use it.
If you are accustomed to using standard moving averages for trend control, the HMA indicator will not be a full replacement: it shows only the general direction of market trend, but it is completely unclear when it is safe (and profitable) to open a deal on this trend.
Turning the HMA down line only tells the trader that you can safely open a short position, and the up turn is − a long one. Use Hull moving average indicator without additional filters − not recommended.


