Forex on balance volume
Idea of the authoring tool OBV (on balance volume indicator) is based on fundamental principle that it is the trading volume that is driving force of market. Granville believed that the dynamics of volumes should outpace price movement, and indicator line should show speed of such a change.
Main idea of indicator
The volume theory assumes that a significant change in volume always precedes a price change; this principle is violated only on short-term speculation. When the volume sharply increases (or decreases), then there is no reaction on price chart for a while, but this means that the price will soon receive similar acceleration.
Before how to use on balance volume, recall: the large participants usually own information that is inaccessible to the «market plankton», and actively use it for their own purposes. They begin to «pour» money into the trading asset at a time when small players are still selling it. The volume begins to change rapidly, and the price at this time stands still (or continues to fall).
After some struggle near the point of equilibrium, a major interest still shifts the price in the right direction (for oneself); then a «market crowd» is included in the auction, which guarantees the asset a strong move. When a sufficient volume of small positions accumulates, large players in the same way organize reverse reversal.
This is how market professionals buy an asset from a small investor for a min and then sell it for max. Therefore, the On Balance Volume indicator almost always shows main reversals of the trend.
Mathematics and parameters
The value of on balance volume is definition by incremental total method. The volume for period is considered positive if price of asset increases (closing price is higher than previous one), and negative if asset decreases. Then the chart of indicator is compared with price chart and analyzes the situation of discrepancy or confirming signals.
- on an uptrend: OBV(i) = OBV(i-1) + Volume(i);
- on descending OBV(i) = OBV(i-1) − Volume(i);
- if the previous closing price is equal to the current one, then OBV(i) = OBV(i-1).
In an ideal situation, price and volume should react in one direction, but with some mutual delay.
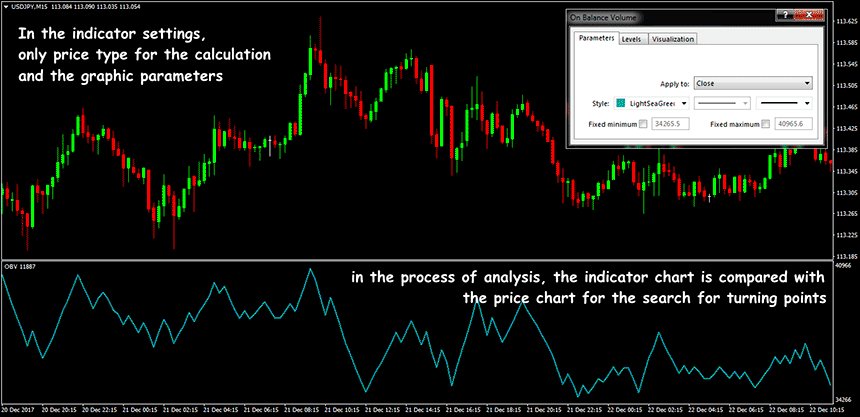
Indicator On-Balance Volume is located in the additional window below price chart, there are no parameters for calculation, settings concern only color scale. For calculation, you can use all types of market prices (open; close; high; low; typical; median; weighted), but the closing price is most often used − this completely eliminates the possibility of redrawing
Trading signals on balance volume
- confirmation of the trend;
- overbought/oversold zones test;
- search for turning points.
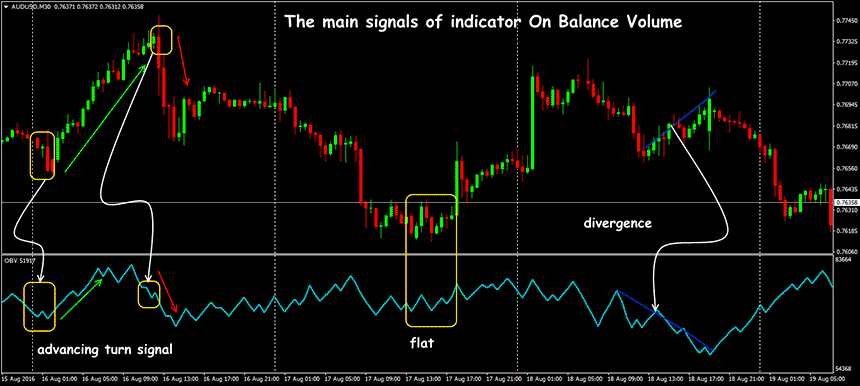
Only goal of the On Balance Volume indicator is to predict a trend change. If price grows along with volume (demand for the asset increases), then it supports an upward trend if price goes down on falling volumes (interest in the asset decreases) − the downward trend will continue.
If price is ahead of OBV indicator line, a warning signal appears − a divergence between indicator line and direction of price. In this case, it is worth waiting for or reversal, or consolidation. During flat, indicator line moves almost horizontally with slight fluctuations.
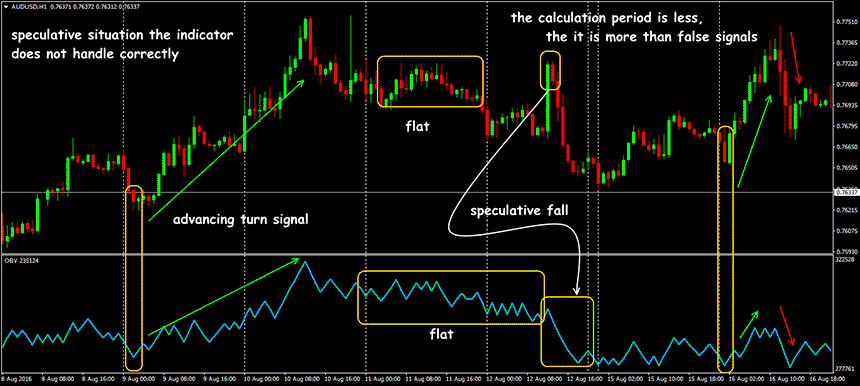
Sometimes, on a falling trend, one can observe a peak in volume − this means that the market «removes» StopLoss volumes and pending orders and then goes down. A similar situation in price increase − if market has already reached «theoretically justified» levels, but there are potential volumes in market for buying, then the buyers are again on the offensive.
If the price does not change, then the OBV will not change, but traffic without volumes often ends quickly. On Balance Volume trading sheet is safer to lead in the direction of trend, which is confirmed by indicator data.
How to use on balance volume indicator?
Numerical value of indicator does not have a trading value (too relative!), only direction of line is used for analysis. By itself, On Balanced Volume does not provide entry points to the market − its signals only confirm information from other indicators.
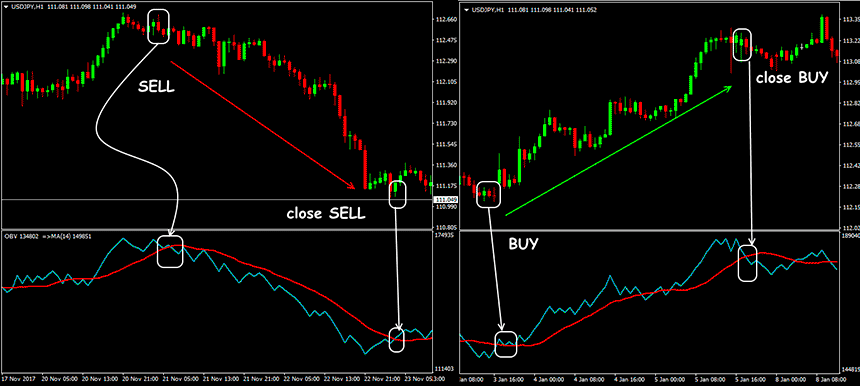
-
buy when OBV line crosses MA line from bottom to top.
-
sell when OBV line crosses MA line from top to bottom.
Most popular strategies are where indicator On Balance Volume Forex is used to search for divergences: OBV performs this situation much more efficiently than traditional MACD or RSI, because the data for its calculation do not undergo additional mathematical processing.
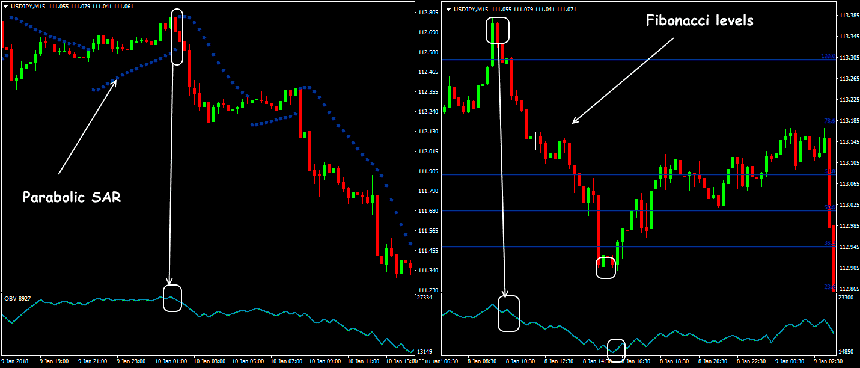
Turning indicator down is a sell signal, and turning indicator up is considered a signal to buy. However, since indicator can supply many false signals, it is recommended to wait 2-3 periods after the turn − then the entry point turns out to be more reliable.
Several practical notes
In general, indicator can be recommended for use in conjunction with standard trend instruments, as well as indicators of power levels. All trades based on the On-Balance Volume indicator require an increased stock for StopLoss, but probability of realizing its signals is high.
Do not forget that indicator OBV (on balance volume) was created for the stock and commodity markets, which have real data on volume of positions. On Forex instead of trading volume is used teak, and the positive correlation between such data is shown only for long periods, beginning from D1. Use OBV on timeframes below H1 is not recommended. It is worth waiting for confirmation of indicator signals for at least 1-3 periods and only then use them to enter market.


