Fractal Indicator
Indicator Fractal is used to search for trend reversal points, local price extremes and strong price levels.
Mathematics and parameters
What Williams called the price Fractal is a graphic pattern of five (or more) consecutive price bars. Fractal shows the price level at which the market tried, but failed to establish a new high or low. A group of five candles in which the maximum of the third candle is greater than the maxima of the two right and left candles is called the upper Fractal. The reverse combination, when the minimum of the third candle is lower than the rest is the lower fractal.
The Fractal indicator is included in the basic set of technical analysis tools of all popular trading terminals and displayed on the chart as arrows up and down on the key bar. There are no special parameters for setting the indicator.
The combinations of Fractals have such characteristics as self-similarity, scaling and memory of the «entry conditions», and, therefore, they can be used successfully for making price forecasts.
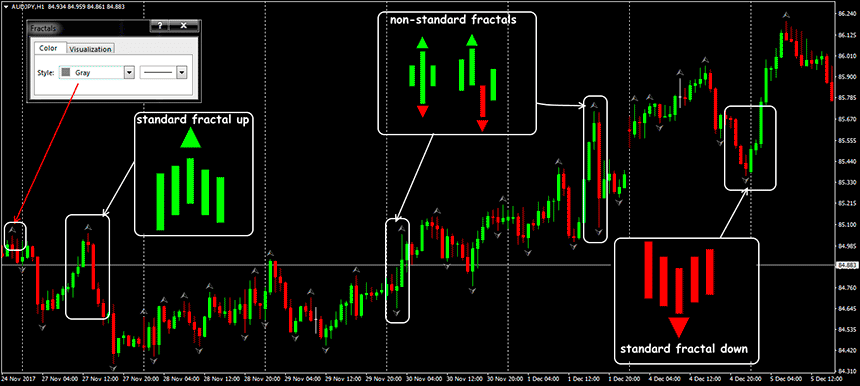
Ideal Fractals on a price chart arise seldom. Usually a trader deals with only with different «fractal models», but the principle of their construction and interpretation of signals is preserved. The construction logic allows for extremums to be inconsistent within the pattern, and the key bar does not need to be in the center.
If in a fractal there are two key bars (max or min), then for search of point of entry is considered only last («fresh»). There are also techniques for analyzing «incomplete» fractals of three or four candles, but they are recommended only for experienced traders because of the large number of false signals.
Trade indicator signals
The longer the period of formation of fractal structure, the more reliable the trading signal given by it. For example, if Fractal Forex indicator shows breakdown of a fractal on a timeframe D1 or W1 is a more reliable signal than at a period of H1 or less.
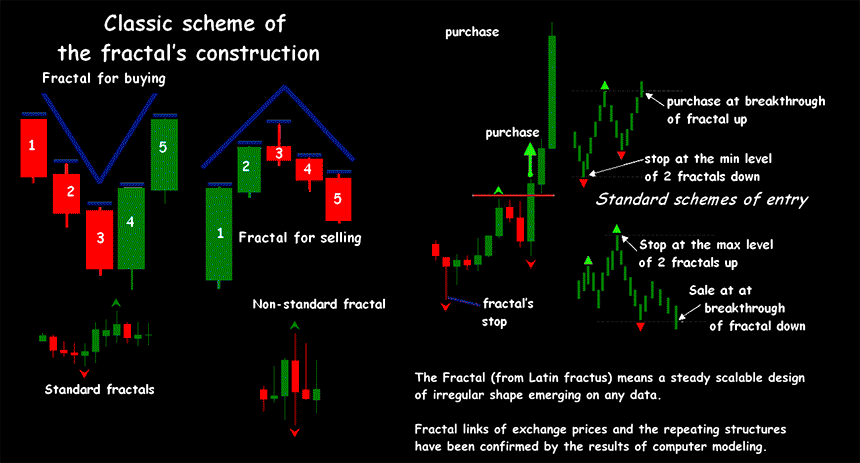
Basic mechanisms for using Fractal indicator Forex:
Confirmation of a trend using fractals
Breakdown of the upper (or lower) boundary of an already formed fractal often causes the appearance of the next fractal in the same direction. This means that the current trend (at least!) Continues, and is likely to intensify. If the upper limit of the fractal breaks, the trend is upward, if the lower (minimum), then in the market − the descending tendency.
Fractals as signals of a trend reversal
Emergence of a fractal means the strong turned impulse confirmed by the preliminary movement when forming all construction. The strongest signal appears immediately after the formation of the fractal. The same group of candles can be used for both upper and lower fractals.
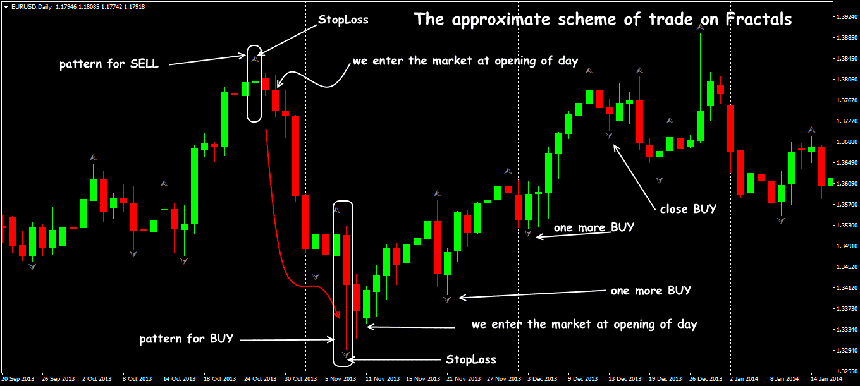
The limit of the upper fractal is the maximum of the arrow above the key bar, the lower one is the minimum of the arrow. Trading signal: you can enter the market in the direction opposite to the fractal, stop − is 1-5 points higher/is lower than border of key bar. In case of formation of an opposite fractal the current trading signal is cancelled.
Fractals as stop-loss order setting points
Signals of fractals indicators can be good reference points for placing StopLoss orders, especially on older timeframes. The following two conditions must be observed.
We set StopLoss only at the level of the last fractal. We open a trade warrant at the maximum / minimum level of the shadow of the fractal candle, not its body. The upper shadow is used for transactions for sale, the lower one for buying.
Strategy with use of the indicator
Strategy of trading Fractal indicator is based on conjoint analysis of fractals and a trend line. Fractals have to show the moment of the beginning of new price dynamics (and point of entry), the balance sheet line reflects development of a trend and its termination (exit point).
As the line of balance it is possible to apply all types of moving averages, it is the best of all − a set from several lines. It will allow not only to evaluate the current trend, but also to evaluate «truth» of fractals, and also possible levels for StopLoss (see here ). We will review two classical examples.
Fractals without additional indicators
Basic concept: emergence of a fractal up − sale, a fractal down − purchase. You can open a trade with a market order, you can − with postponed warrants: set BuyStop to 2-5 points above the maximum of the second candle from the key fractal bar; SellStop is 2-5 points below the low of the second candle.
Fractal and Alligator
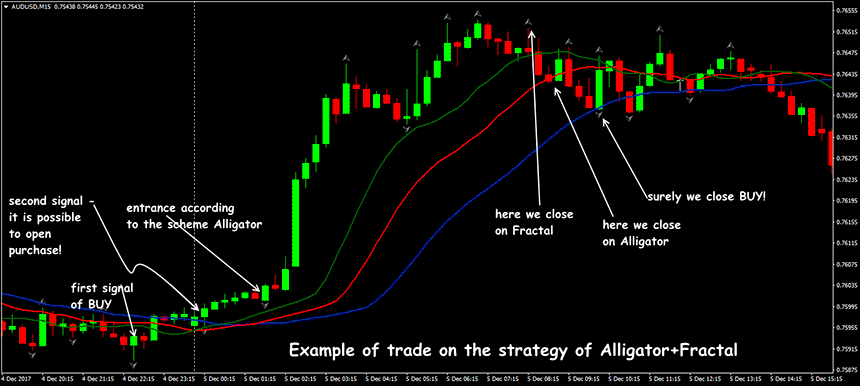
Fractals should always be confirmed and filtered by other technical tools, and, naturally, Williams recommends using Alligator. According to his strategy, a purchase transaction does not open if the fractal is below the «Tooth» line; also skip a sell signal, if the fractal is above the «Tooth» line. Patterns outside «Mouth» of the Alligator will matter only before breakdown of price level or emergence of a new fractal.
Several practical notes
The true breakdown of a fractal on any timeframe shall be confirmed by certain volumes. A firm breakthrough candle but with the small volume appears to be an unstable signal. Also for an assessment of volumes it is recommended to use standard designs of Price Action.
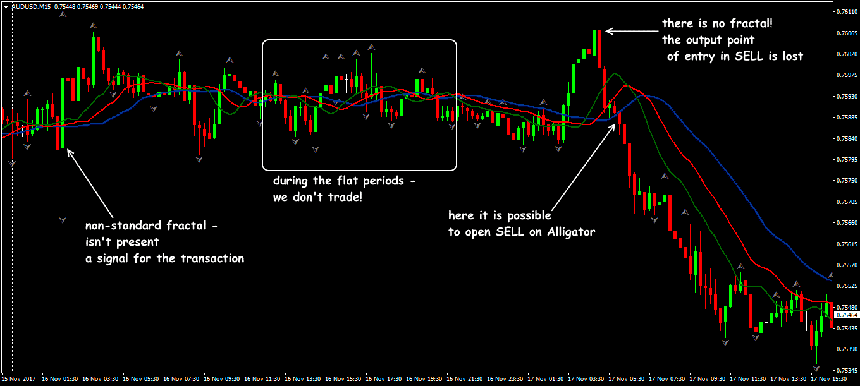
Capability to be redrawn it is considered a serious problem for Forex Fractal indicator. The basic scheme of a fractal supports, at least, five bars, and only the last closed candle confirms its real direction. If the last bar is closed above a price maximum (or below a minimum), then the fractal will not be confirmed and will just disappear from a price chart.
Schemes of trade with use of Fractal indicators are most effective in the stock market while speculators on Forex often «break» fractal mathematics. The asset volatility, the more «false» is higher (or difficult for treatment) patterns will generate the market. Until the trader waits for emergence of the «correct» fractal, he can lose many profitable trade situations. Therefore it makes sense to use fractals in trade strategy only in a set with standard trend indicators.


