مؤشر فيبوناتشي (Fibonacci Indicator)
Fibonacci’s indicators are used for determination of target zones and the moments of a turn, and designate them directly on a price chart. Classical levels of Fibo – the optimum tool for delimitation of local price corrections and levels of support/resistance.
Mathematics and parameters
The algorithm for calculating Fibonacci numbers has long been implemented in technical analysis and is included in the tool kit of any trading terminal. Fibonacci lines are always placed on a real, already formed trend.
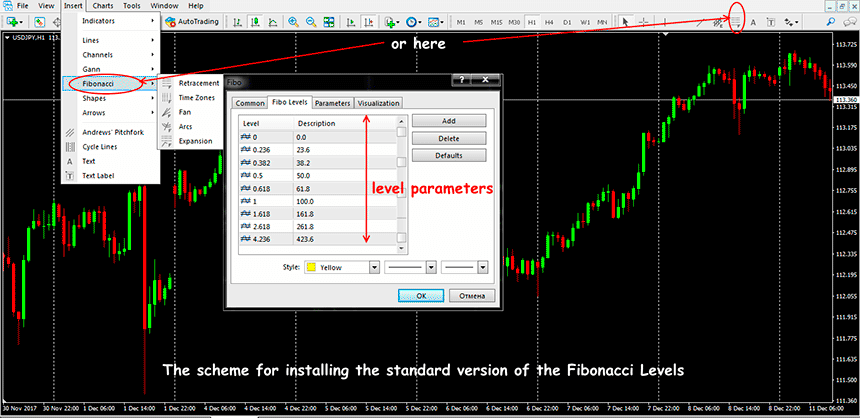
In the bull market, the line starts from min and «pulls» to max or a strong price level, at which a reversal is possible. In the descending market, the levels are built in the reverse order: from max to min.
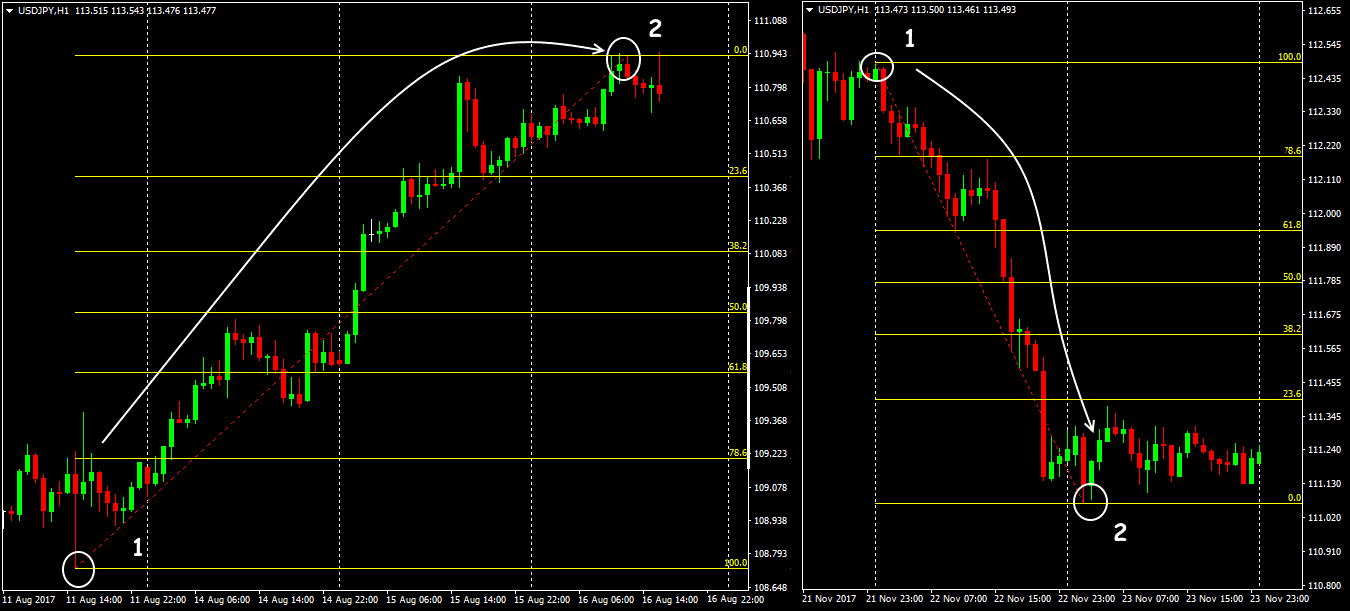
To build correctly, you need to evaluate the current trend (it should gradually weaken) and draw a line from its starting point to a potential point of a turn. Fibonacci’s levels will be built automatically between the beginning and end of the price movement.
The red dashed line is the key one, it marks the base trend, the horizontal lines mark key levels in% of the total value range. To open the properties of the indicator, you need to double-click on the key line with the left mouse button. If necessary, you can rebuild the Fibonacci Forex indicator − just move the start and end point to a new position. In the settings, you can change the color of the line display and the list of levels.
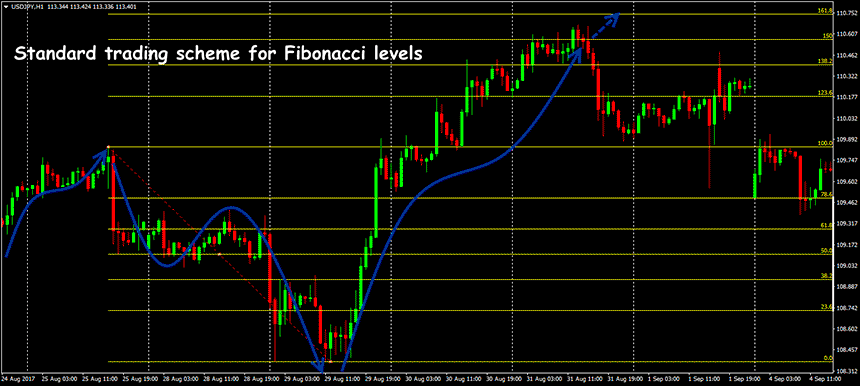
It is recommended to build a Fibo grid in the direction from left to right: in this case, you need to trade in the direction of raising the levels (from 0 to 100 and above). However, practice shows that the mathematical dependence of levels is maintained even when the construction is reversed. Fibo levels can be built on any timeframe − this math is always effective.
Technical meaning of basic levels of Fibonacci
- possible correction goals;
- possible goals of continuation of the trend;
- strong support/resistance levels.
- 23.6%: the first level at which local correction and short-term consolidation is possible. The level is considered to be weak, the price in most cases goes to the following levels. It is possible to use for a careful input in a position
- 38.2%: a zone of confident entry into the transaction; is considered a strong level of support/resistance. Usually in this zone there are large volumes of pending orders, which cause sharp movements. Therefore, it is recommended to obtain additional confirmation so as not to err with the direction.
- 50%: it is considered the most likely for the end of medium-term corrections. A level with a high probability of a trend reversal, and the stronger the correction from this level, the more time will be required on recovery of the main tendency.
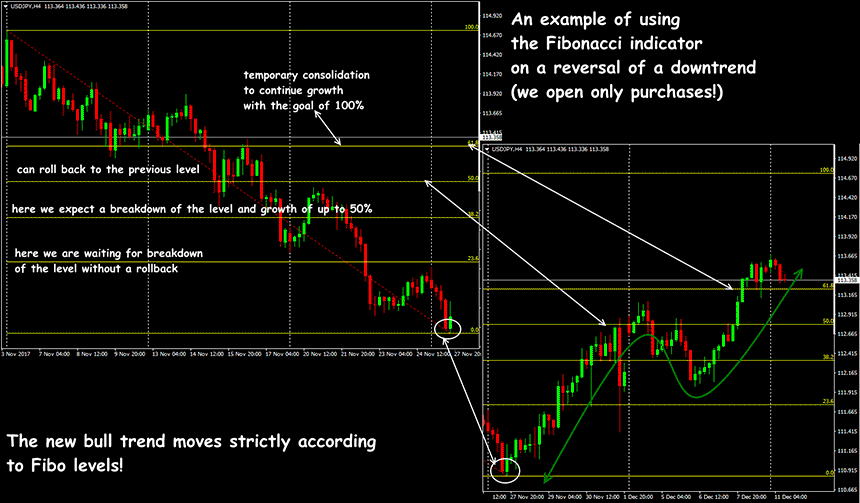
- 61.8%: the strongest level of development of the previous price movement. It is here that the most «nervous» participants, who do not maintain pressure against the trend, close their deals. After that, the price usually unfolds (or there is a strong pullback), and a sure break of this line means the beginning of a new trend.
- 78.6% (in some versions − 76.4%): the level is not part of the classical sequence, but this is the square root of 0.618 (the Fibonacci base), so it should be taken into account. On Forex in this zone are usually placed large orders StopLoss, which increases the likelihood of sudden movements or reversals. Trend corrections rarely reach this zone, but if the price still broke through and consolidated behind this level, it will move (at least) to the level of 100%.
- 100%: the fullest trend reversal or long-term consolidation is most likely. It is not recommended to open new deals.
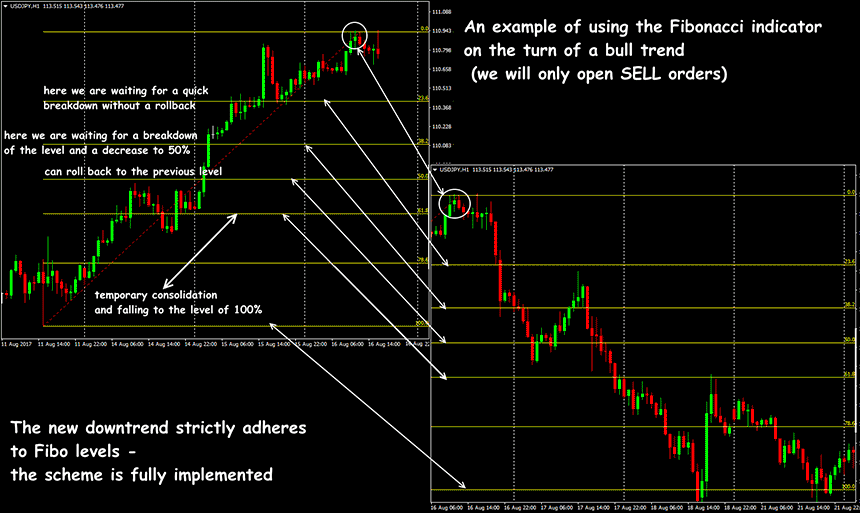
Levels 38.2%, 61.8%, 78.6% and 161.8% are considered to be the strongest and are recommended for entry in the direction of the main trend. Levels above 100% (123.6%, 138.2%, 150%, 161.8%, 200%, 261.8%, 423.6%) are called «Fibonacci extension», are considered weaker and show potential areas for a very strong trend.
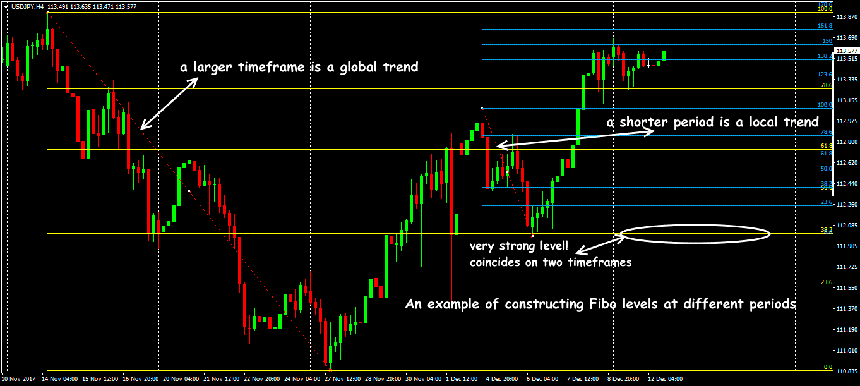
In practice, the stable results are obtained by the method of simultaneous construction of several Fibo grids: on the large timeframes − the global trend, on the smaller ones (inside the trend) − for constant monitoring of transactions. The coincidence of Fibonacci levels, built on different periods, makes such a price level especially strong.
Trade indicator signals
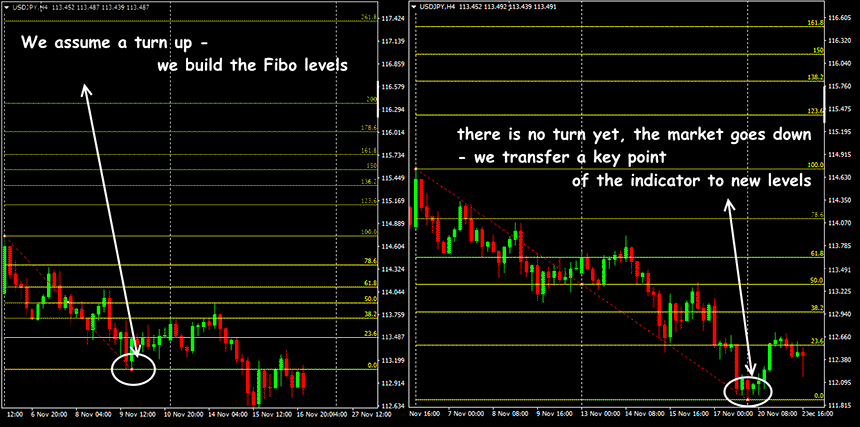
As a result we receive:
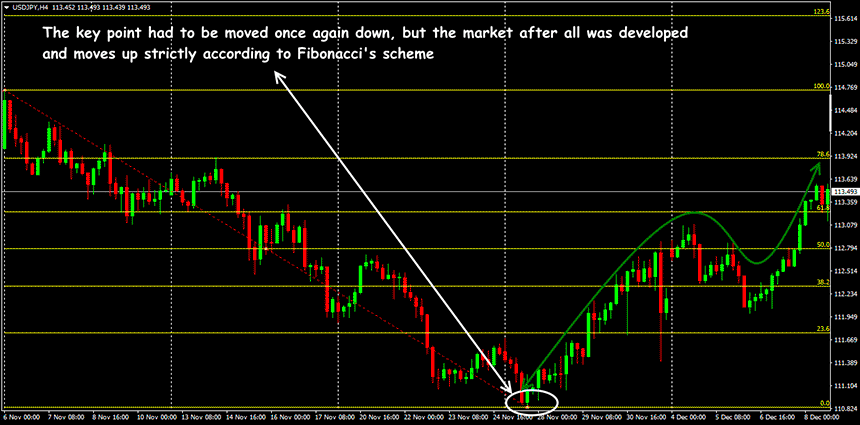
Mathematics Fibo works perfectly on any trading assets and timeframes, but compliance with technical conditions and rules of money management is a zone of the trader’s responsibility.
Strategy with use of the indicator
At once we will note: the Fibonacci system is not a full-fledged trading strategy, but it is possible to define two ways of entering the market.
Aggressive input:
Always open a deal when the price reaches each level of correction, StopLoss set on the opposite side of the Fibonacci level. If StopLoss works, re-enter the market at the next level; continue until the price goes back. The method is dangerous, it is recommended only for large deposits and confident traders.
Conservative input:
We wait until the level of support/resistance is confirmed to enter the market only after retest.
Fibonacci levels can be used for scalping, but the smaller the timeframe of the graph, the more false signals. For Fibonacci expansion levels, there is an easier way to use: you can close a trade if the price forms a strong support / resistance at this level. The basic variants of Fibonacci strategies can be found here.
Several practical notes
Correctly installed Fibonacci lines well «see» strong price levels on the market, help to find the optimal entry/exit point and correctly install StopLoss/TakeProfit.
Fibo levels can work incorrectly on trading assets that have a strong fundamental dependence on raw materials, such as USD / CAD − on the price of oil. Any situations of force majeure (military or political conflicts), regional or branch problems (natural disasters and technogenic catastrophes) cause speculative movements and the «logic» of Fibonacci levels can be lost.
However, do not forget that the Fibonacci technique is a classic example of a market self-fulfilling prophecy. The accessibility and ease of use of the Fibonacci indicator and the strategist on its basis causes the effect of the «same look»: most traders think alike and perform the same graphic constructions.
As a result, large trading volumes are concentrated in the Fibo level zone, and breakdown or rollback from levels causes operation of a huge number of the postponed warrants. In the market there are strong speculative movements, the trader should wait and open new deals only after the market itself will determine the strongest direction. That is why the Fibonacci indicator should only be used in conjunction with other elements of technical analysis.


